
BID EVALUATION USING DESCRIPTIVE ANALYSIS
 analyzeit - updated on March 27, 2024 . 3 Min Read
The objective is to perform a bid evaluation using descriptive analysis and data visualization
Average timeline (days) of the stages for each procurement method
| Stages | Procurement Methods | |||
|---|---|---|---|---|
| ICB | NCB | RB | SS | |
| Bid evaluation to completion of bid evaluation | 5 | 16 | 2 | 3 |
| Procurement Committee Meeting to Procurement Committee Endorsement | 1 | 3 | 1 | 8 |
| Procurement Committee Endorsement to Head of Procuring Entity Approval | 5 | 12 | 120 | 10 |
| Stand Still Period to End of Stand Still Period | 3 | 4 | 0 | |
| Bid Validity Extensions | 95 | 168 | 118 | 14 |
The table above shows the average days it took each procurement method to complete each stage.
From Date of Bid Evaluation Committee Meeting to Date of Completion of Bid Evaluation Exercise
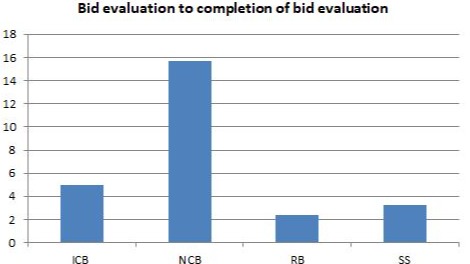
The graph above shows that NCB procurement method took the longest time while RB took the shortest time.
From Date of Procurement Committee Meeting to Date of Procurement Committee Endorsement
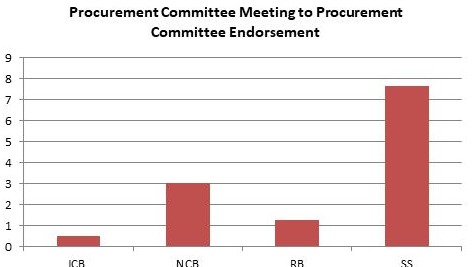
The graph above shows that SS procurement method took the longest time while ICB took the shortest time.
From Procurement Committee Endorsement to Head of Procuring Entity Approval
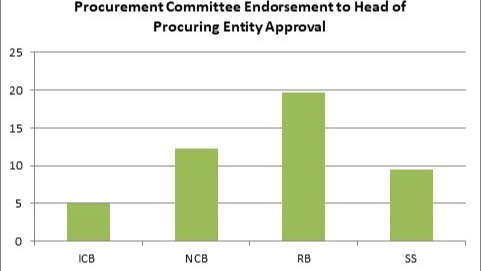
RB method took longest time to complete the process while ICB took the shortest time.
From Start of Stand Still Period to End of Stand Still Period
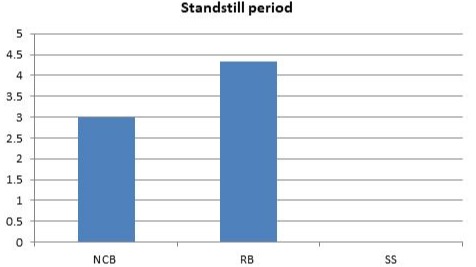
RB method took longest time to complete the process while SS took the shortest time. ICB was not included in the process.
Bid Validity Extensions (from start date to end date)
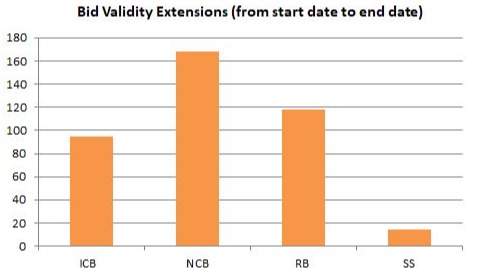
NCB method took longest time to complete the process while SS took the shortest time.
What percentage of times are Bid Validity Extensions being done?
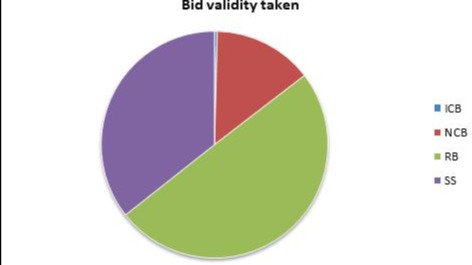
The pie chart shows the percentage time bid validity extensions were taken according to each procurement method. RB was give bid extension the highest times than all the other procurement methods. ICB was given no extension.