THE EFFECT OF AGE, MAXIMUM HEART RATE AND CHOLESTEROL LEVEL ON RESTING BLOOD PRESSURE
 analyzeit - updated on March 27, 2024 . 3 Min Read
Introduction
The aim of the study is to determine the effect of age, maxHR, cholesterol level which are the independent variables on resting blood pressure which is the dependent variable using multiple regression. Classification Technique (Decision tree) is also used to study the characteristics and relationship between heart disease, cholesterol level, resting Blood Pressure, age, and maximum heart rate.
Data Description
The sample size for the data set is 747, this consists of 12 variables that measures blood pressure. The survey was obtained by asking respondent information concerning their blood pressure, age and their medical conditions. The variables are: age, cholesterol, maxHR, maxBP, heart disease
Data preprocessing
The qualitative variables were converted from string to numeric by coding it as 0 represent No and 1 represent Yes, this is in order to make the data more convenient for analysis. Homogeneity test was carried out on the data set and the outcome showed the variance was not equal. As a result of the unequal the dependent variable was transformed variable by taking the natural logarithm of the data.
Methodology
Two techniques were used in analyzing the dataset namely multiple linear regression model and classification (decision tree) technique.
Decision tree
This is a technique that identifies the characteristics and relationship or association between the independent (explanatory) variable with respect to the dependent (outcome or response) variable in a tree structure. This is used to generate relationship between different features and outcomes
Justification for using decision tree
We want to discover characteristic and relationship between heart disease, cholesterol, resting Blood Pressure, age and maximum heart rate.
The reason for applying multiple regression is to determine how age, maxHR, cholesterol level affect resting blood pressure. The regression model can be used to predict resting blood pressure using age, maxHR and cholesterol level.

Linearity of the data
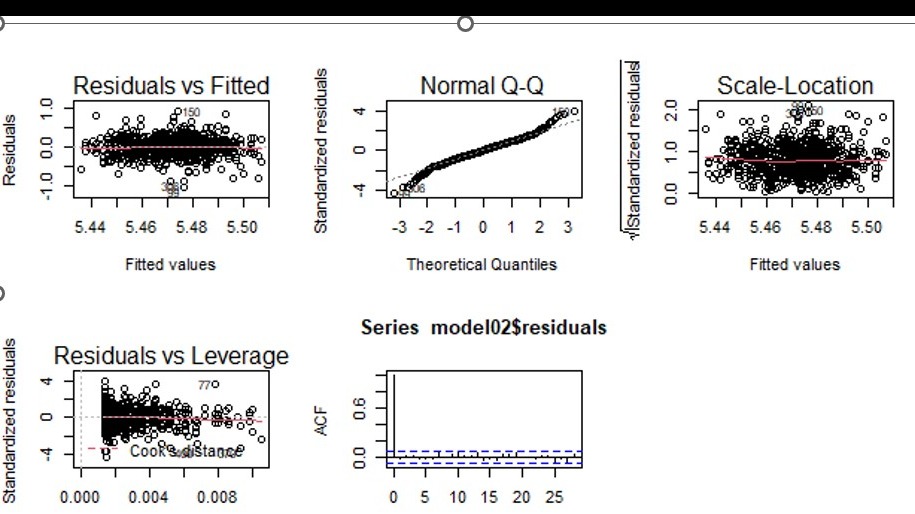
Checks the linear assumption by plotting the Residuals against the fitted, the plot show no fixed pattern. The red line should be zero.
Normality of residuals
QQ plot can be used to graphically determine if there is normality. The line in the QQ plot should follow a straight line. In this study, all the points fall approximately along this reference line, so we can assume normality.
Autocorrelation of the data
The ACF graph can be used to visually observe autocorrelation. From the plot we see that there is no autocorrelation because the point easily decays to zero
Homoscedasticity
The chart is used to graphical observe if residuals are equally spread alongside the ranges of predictors. If the spread are horizontal then we have equal variance
Hypothesis testing
H0: resting blood pressure is not determined by age and level cholesterol
H1: resting blood pressure is determined by age and level cholesterol
| coefficent | Estimates | ST.Error | t-value | p-value |
|---|---|---|---|---|
| intercept | 4.656e+00 | 3.071e-02 | 151.629 | 0.000 |
| cholesterol | 1.738e-04 | 7.626e-05 | 2.279 | 0.022 |
| Age | 3.472e-03 | 4.745e-04 | 7.317 | 0.000 |
The above summary model shows that after dropping the variables that are not significant we are left with the cholesterol and age which is significant to our model having a p<0.05, since the p values of the two variables (cholesterol and age) are significant we will reject the null hypothesis and conclude that age and cholesterol affect the resting blood pressure rate.
Application of the dataset to the classification technique (decision tree)
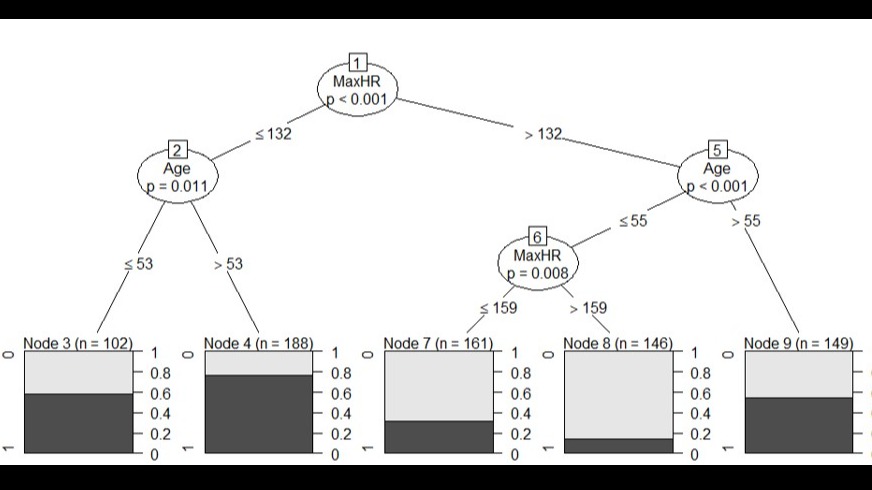
Categorical classification was applied because the dependent variable is a categorical variable. Dependent variable: heart disease (0 represents No heart diseases and 1 represents presence of heart diseases.) Independent variables: cholesterol, age, maxHR, and restingBP

The tree graph above observes the relationship among heart disease, cholesterol, resting Blood Pressure, age, maximum heart rate and we see that the decision tree algorithm chooses the most significant variable and we see from above that maxHR is significant with p<0.001. From the tree graph above we can see that anyone who has a maximum heart rate of less than or equal to 132 and age greater than 53 have high chance of having heart disease
Conclusion
From the summary model of the regression we can see that after dropping the variables that are not significant we are left with the cholesterol level and age which is significant to our model having a 0.05, this shows that cholesterol level and age have impact on resting blood pressure. From the decision tree analysis we can conclude that anyone who has a maximum heart rate of less or equal than 132 and age greater than 53 have high chance of having heart disease.